|
Time
|
Data and Events
|
Importance
|
|
To be determined
|
The European Central Bank holds a central bank forum in Sintra.
|
★★★
|
|
14:00
|
UK Q1 GDP year-on-year final value
|
★★★
|
|
UK Q1 current account
|
★★★
|
|
15:00
|
Switzerland June KOF Economic Leading Indicator
|
★★★
|
|
16:30
|
UK May Bank of England mortgage approvals
|
★★★
|
|
20:00
|
Germany June CPI month-on-month preliminary value
|
★★★
|
|
21:45
|
US June Chicago PMI
|
★★★
|
|
22:00
|
2027 FOMC voting member Bostic speaks on the US economic outlook.
|
★★★
|
|
22:30
|
US June Dallas Fed Business Activity Index
|
★★★
|
|
Next day
01:00
|
2025 FOMC voting member Goolsbee speaks.
|
★★★
|
|
Next day
03:00
|
European Central Bank President Lagarde speaks.
|
★★★
|
|
Variety
|
Viewpoint
|
Support range
|
Resistance range
|
|
US Dollar Index
|
Weak oscillation
|
96-97
|
99.5-100
|
|
Gold
|
Short-term adjustment
|
3220-3250
|
3300-3330
|
|
Crude oil
|
Short-term adjustment
|
64-65
|
79-80
|
|
Euro
|
Strong oscillation
|
1.1580-1.1600
|
1.1800-1.1850
|
*Pre-market views are time-sensitive and limited, are predictions only, and are for reference and learning purposes only. They do not constitute investment advice, and operational risks are borne by the individual. Investment carries risks; trading requires caution.
Fundamental Analysis:
In June, the Federal Reserve maintained interest rates for the fourth consecutive time. The dot plot indicates two rate cuts within the year. Inflation levels are slightly high, uncertainty in the economic outlook has decreased, and the unemployment rate remains low, indicating a stable labor market. In May, non-farm payrolls added 139,000 jobs, roughly in line with expectations, and the unemployment rate remained unchanged, showing a robust labor market. The unadjusted CPI year-on-year in May slightly increased but was below expectations; the core PCE price index showed a slight rebound. Focus on Tuesday’s manufacturing PMI and Thursday’s June non-farm data.
Technical Analysis:
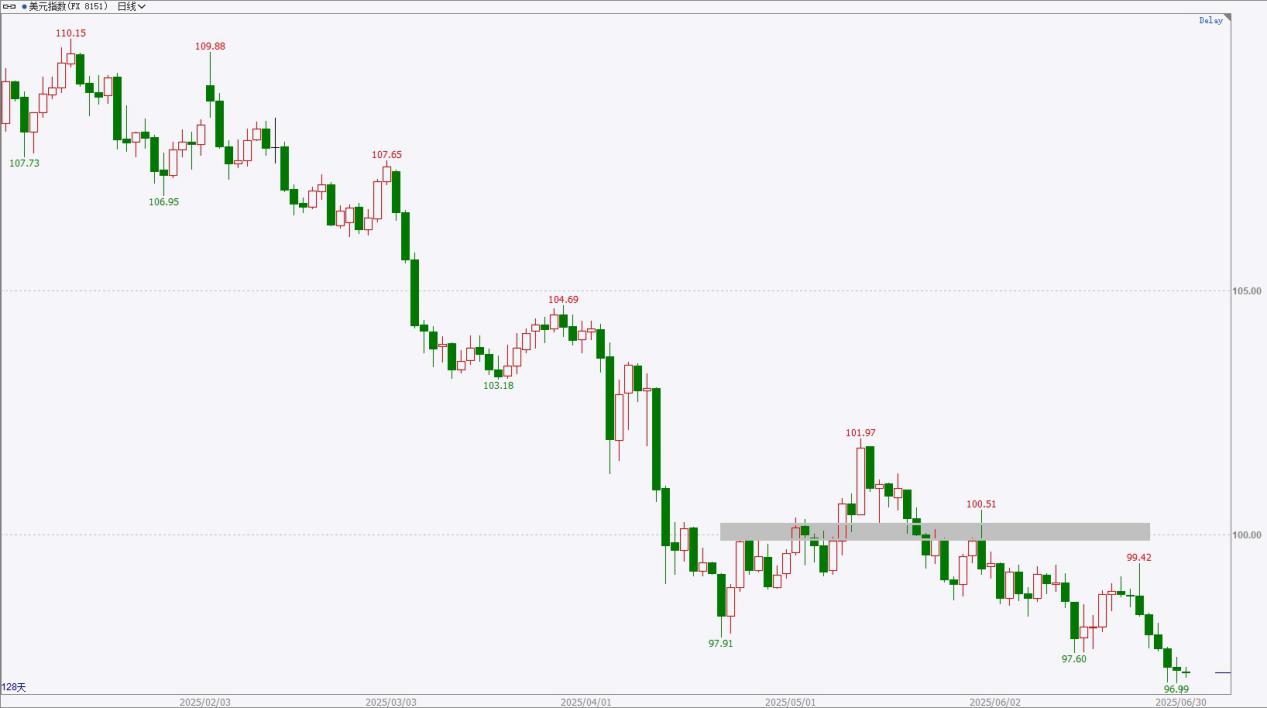
The US Dollar Index has recently shown weak performance, with daily oscillations trending downward and new lows being set without signs of stabilization. The rate of decline is slowing, and caution is advised for small-scale rebounds. In the short term, a weak oscillation strategy may continue. Overall, the larger structure indicates a weak oscillation, with a large bearish candle on the weekly chart, maintaining a weak trend. The upper resistance area is around 99.5-100, while the lower support area is around 96-97.
Viewpoint: Weak oscillation, prices set new lows without signs of stabilization.
*Pre-market views are time-sensitive and limited, are predictions only, and are for reference and learning purposes only. They do not constitute investment advice, and operational risks are borne by the individual. Investment carries risks; trading requires caution.
Fundamental Analysis:
Geopolitical tensions in the Middle East are escalating, with conflicts between Israel and Iran, and instability in Eastern Europe. The ECB’s June interest rate decision marked the seventh consecutive 25 basis point cut, nearing the end of the rate-cutting cycle, with downward revisions to inflation expectations for this and next year, as well as GDP growth forecasts for next year. The June Federal Reserve interest rate decision maintained rates, with slightly high inflation levels and a stable labor market, indicating two rate cuts within the year according to the dot plot. In May, non-farm payrolls in the US saw a slight decline in job additions, with the unemployment rate unchanged; the unadjusted CPI year-on-year in May showed slight warming. Focus on US non-farm data.
Technical Analysis:
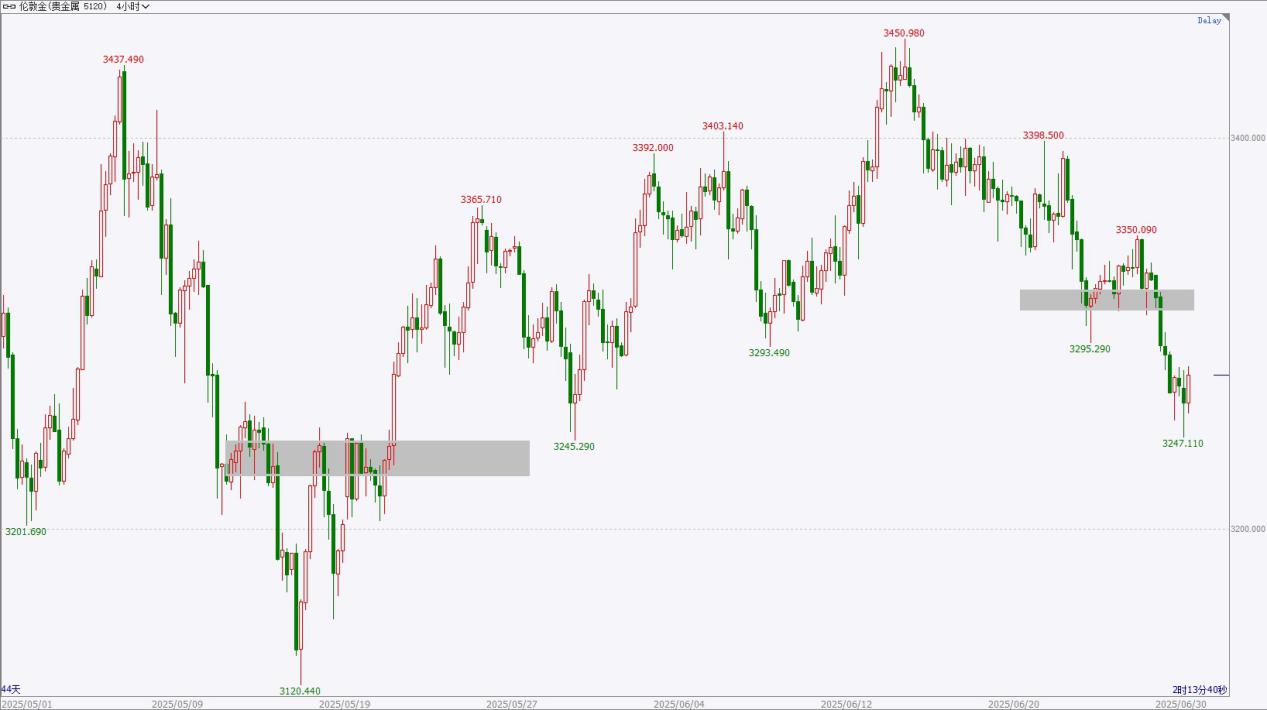
Gold prices performed weakly last week, with a significant decline on the daily chart. There may be selling pressure above, and no signs of stabilization have appeared yet. Currently, it is close to the support area, and a rebound may occur in the short term. It is advisable to look for short-term long opportunities during the day and to take profits in a timely manner. Pay attention to the resistance level above, and at that time, look for high short opportunities. From a larger perspective, the daily chart shows a strong oscillation, with a pullback near previous highs. The small-level resistance is around 3300-3330, while the support level is around 3220-3250.
Viewpoint: Short-term adjustment, short-term long opportunities during the day, focus on the resistance area above.
*Pre-market views are time-sensitive and limited, are predictions only, and are for reference and learning purposes only. They do not constitute investment advice, and operational risks are borne by the individual. Investment carries risks; trading requires caution.
Fundamental Analysis:
The June EIA monthly report slightly raised the crude oil price forecasts for this year and next. The OPEC monthly report maintained the global oil demand growth expectations for this year and next, as well as the economic growth expectations for this year and next. The IEA monthly report slightly lowered the oil demand forecasts for this year and next. At the end of May, the OPEC+ ministerial meeting agreed to set the 2025 oil production as the benchmark for 2027, with another round of negotiations expected in early June, potentially reaching an agreement to accelerate oil production increases in July. EIA crude oil inventories have decreased for the fifth consecutive week, and this data is quite volatile, which may affect the supply-demand structure.
Technical Analysis:
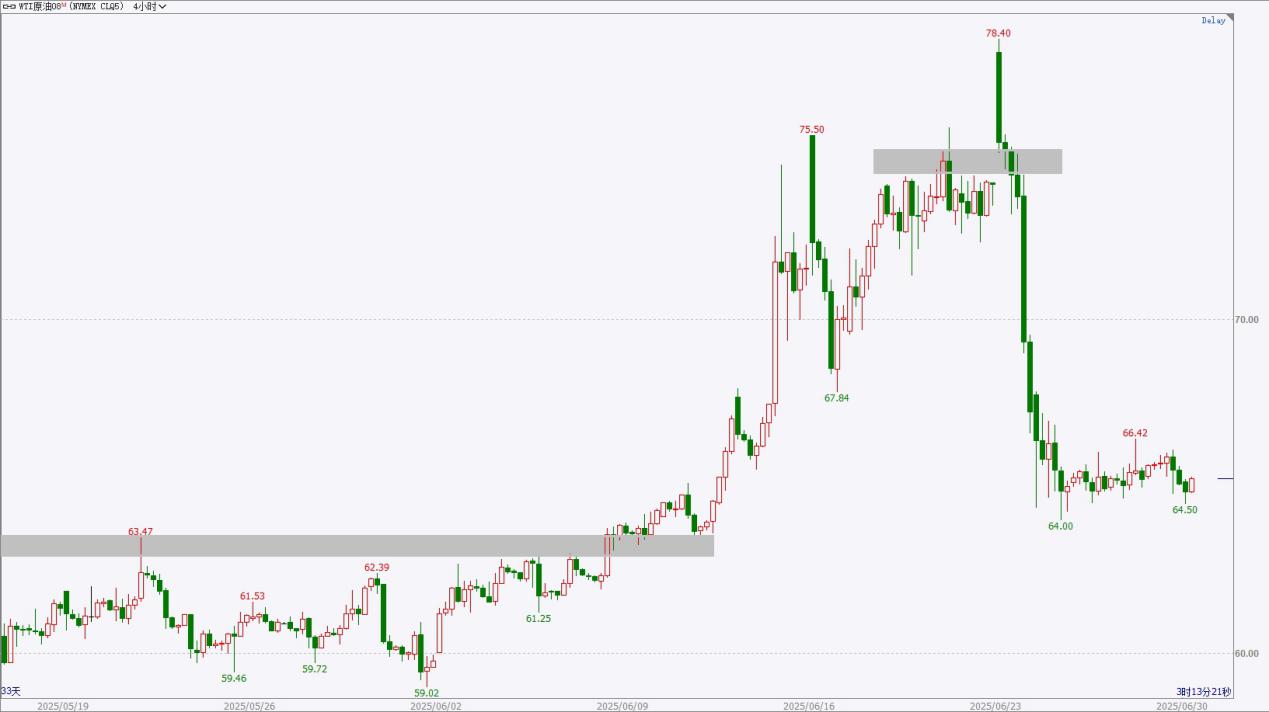
U.S. crude oil prices fell significantly last week, entering an adjustment phase, with prices testing the support area and signs of slowing decline. The small cycle is showing oscillation, and attention should be paid to signs of a bottoming out. At that time, low long opportunities can be attempted. Overall, crude oil had a significant rise earlier, reaching the pressure area above, and is currently undergoing a short-term correction. The pressure area above is around 79-80, while the support area below is around 64-65.
Viewpoint: Short-term adjustment, prices testing the neckline support structure, focus on signs of a bottoming out.
*Pre-market views are time-sensitive and limited, are predictions only, and are for reference and learning purposes only. They do not constitute investment advice, and operational risks are borne by the individual. Investment carries risks; trading requires caution.
Fundamental Analysis:
The European Central Bank’s June interest rate decision saw a continuous seventh rate cut of 25 basis points, with the rate cut cycle nearing its end. There has been no discussion of the neutral interest rate, and inflation forecasts for this year and next have been lowered, along with the GDP growth forecast for next year. The trade escalation has led to a slowdown in economic growth and inflation. In June, the Federal Reserve’s interest rate decision remained unchanged, with a robust labor market, slightly higher short-term inflation, and reduced economic uncertainty. The dot plot indicates two rate cuts within the year. The Eurozone’s June manufacturing PMI slightly missed expectations, with not much difference. Attention should be paid to U.S. non-farm payroll data.
Technical Analysis:
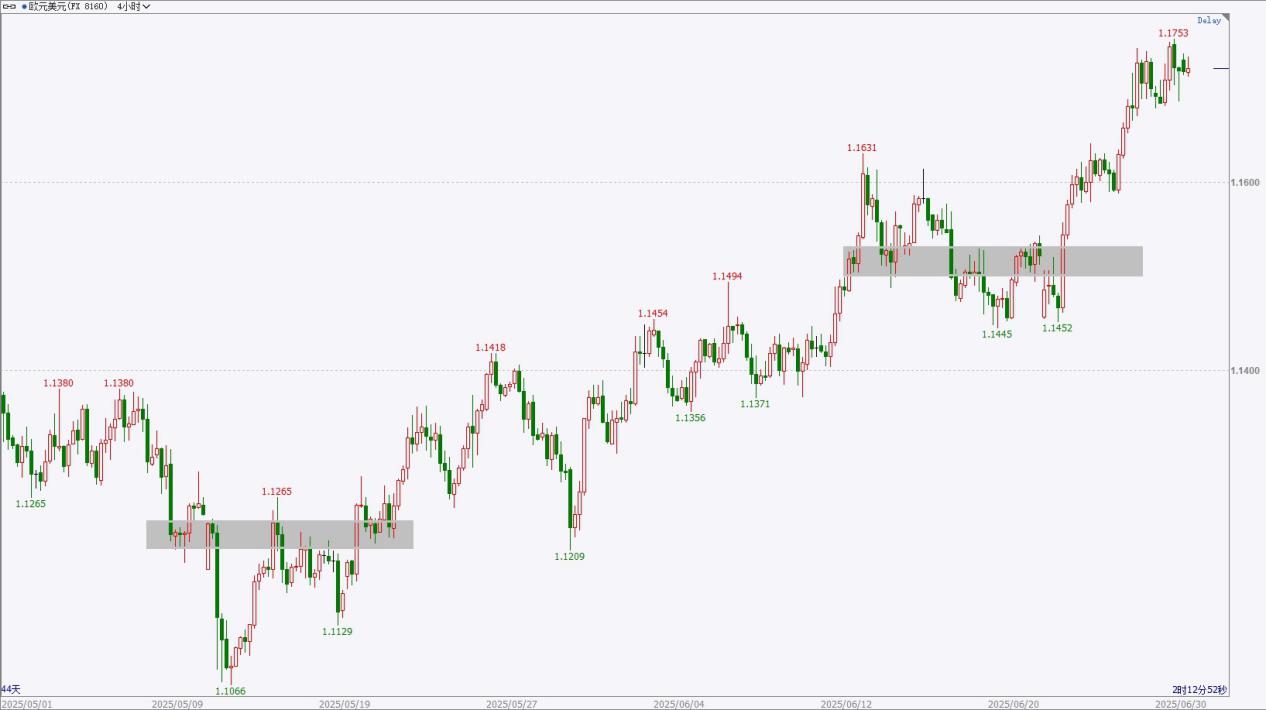
The euro has recently performed strongly, with a significant rise on the daily chart and new highs in the small cycle. The current position is showing oscillation, and there may be selling pressure above. If there are long positions, it is advisable to take profits at highs. In the short term, the oscillation may remain strong, waiting for a pullback to look for low long opportunities. Overall, the daily chart shows an upward oscillation, with a strong structure on a larger scale. The pressure area above is around 1.1800-1.1850, while the support area below is around 1.1580-1.1600.
Viewpoint: Oscillation is strong, focus on low long opportunities during pullbacks, and take profits at highs.
*Pre-market views are time-sensitive and limited, are predictions only, and are for reference and learning purposes only. They do not constitute investment advice, and operational risks are borne by the individual. Investment carries risks; trading requires caution.
Daily Reviews
Our award-winning team of analysts provides keen and insightful technical and fundamental analysis to understand daily market news and investment trading opportunities
HTFX Daily Forex Commentary 0630
Time
Data and Events
Importance
To be determined
The European Central Bank holds a central bank forum in Sintra.
★★★
14:00
UK Q1 GDP year-on-year final value
★★★
UK Q1 current account
★★★
15:00
Switzerland June KOF Economic Leading Indicator
★★★
16:30
UK May Bank of England mortgage approvals
★★★
20:00
Germany June CPI month-on-month preliminary value
★★★
21:45
US June Chicago PMI
★★★
22:00
2027 FOMC voting member Bostic speaks on the US economic outlook.
★★★
22:30
US June Dallas Fed Business Activity Index
★★★
Next day
01:00
2025 FOMC voting member Goolsbee speaks.
★★★
Next day
03:00
European Central Bank President Lagarde speaks.
★★★
Variety
Viewpoint
Support range
Resistance range
US Dollar Index
Weak oscillation
96-97
99.5-100
Gold
Short-term adjustment
3220-3250
3300-3330
Crude oil
Short-term adjustment
64-65
79-80
Euro
Strong oscillation
1.1580-1.1600
1.1800-1.1850
*Pre-market views are time-sensitive and limited, are predictions only, and are for reference and learning purposes only. They do not constitute investment advice, and operational risks are borne by the individual. Investment carries risks; trading requires caution.
Fundamental Analysis:
In June, the Federal Reserve maintained interest rates for the fourth consecutive time. The dot plot indicates two rate cuts within the year. Inflation levels are slightly high, uncertainty in the economic outlook has decreased, and the unemployment rate remains low, indicating a stable labor market. In May, non-farm payrolls added 139,000 jobs, roughly in line with expectations, and the unemployment rate remained unchanged, showing a robust labor market. The unadjusted CPI year-on-year in May slightly increased but was below expectations; the core PCE price index showed a slight rebound. Focus on Tuesday’s manufacturing PMI and Thursday’s June non-farm data.
Technical Analysis:
The US Dollar Index has recently shown weak performance, with daily oscillations trending downward and new lows being set without signs of stabilization. The rate of decline is slowing, and caution is advised for small-scale rebounds. In the short term, a weak oscillation strategy may continue. Overall, the larger structure indicates a weak oscillation, with a large bearish candle on the weekly chart, maintaining a weak trend. The upper resistance area is around 99.5-100, while the lower support area is around 96-97.
Viewpoint: Weak oscillation, prices set new lows without signs of stabilization.
*Pre-market views are time-sensitive and limited, are predictions only, and are for reference and learning purposes only. They do not constitute investment advice, and operational risks are borne by the individual. Investment carries risks; trading requires caution.
Fundamental Analysis:
Geopolitical tensions in the Middle East are escalating, with conflicts between Israel and Iran, and instability in Eastern Europe. The ECB’s June interest rate decision marked the seventh consecutive 25 basis point cut, nearing the end of the rate-cutting cycle, with downward revisions to inflation expectations for this and next year, as well as GDP growth forecasts for next year. The June Federal Reserve interest rate decision maintained rates, with slightly high inflation levels and a stable labor market, indicating two rate cuts within the year according to the dot plot. In May, non-farm payrolls in the US saw a slight decline in job additions, with the unemployment rate unchanged; the unadjusted CPI year-on-year in May showed slight warming. Focus on US non-farm data.
Technical Analysis:
Gold prices performed weakly last week, with a significant decline on the daily chart. There may be selling pressure above, and no signs of stabilization have appeared yet. Currently, it is close to the support area, and a rebound may occur in the short term. It is advisable to look for short-term long opportunities during the day and to take profits in a timely manner. Pay attention to the resistance level above, and at that time, look for high short opportunities. From a larger perspective, the daily chart shows a strong oscillation, with a pullback near previous highs. The small-level resistance is around 3300-3330, while the support level is around 3220-3250.
Viewpoint: Short-term adjustment, short-term long opportunities during the day, focus on the resistance area above.
*Pre-market views are time-sensitive and limited, are predictions only, and are for reference and learning purposes only. They do not constitute investment advice, and operational risks are borne by the individual. Investment carries risks; trading requires caution.
Fundamental Analysis:
The June EIA monthly report slightly raised the crude oil price forecasts for this year and next. The OPEC monthly report maintained the global oil demand growth expectations for this year and next, as well as the economic growth expectations for this year and next. The IEA monthly report slightly lowered the oil demand forecasts for this year and next. At the end of May, the OPEC+ ministerial meeting agreed to set the 2025 oil production as the benchmark for 2027, with another round of negotiations expected in early June, potentially reaching an agreement to accelerate oil production increases in July. EIA crude oil inventories have decreased for the fifth consecutive week, and this data is quite volatile, which may affect the supply-demand structure.
Technical Analysis:
U.S. crude oil prices fell significantly last week, entering an adjustment phase, with prices testing the support area and signs of slowing decline. The small cycle is showing oscillation, and attention should be paid to signs of a bottoming out. At that time, low long opportunities can be attempted. Overall, crude oil had a significant rise earlier, reaching the pressure area above, and is currently undergoing a short-term correction. The pressure area above is around 79-80, while the support area below is around 64-65.
Viewpoint: Short-term adjustment, prices testing the neckline support structure, focus on signs of a bottoming out.
*Pre-market views are time-sensitive and limited, are predictions only, and are for reference and learning purposes only. They do not constitute investment advice, and operational risks are borne by the individual. Investment carries risks; trading requires caution.
Fundamental Analysis:
The European Central Bank’s June interest rate decision saw a continuous seventh rate cut of 25 basis points, with the rate cut cycle nearing its end. There has been no discussion of the neutral interest rate, and inflation forecasts for this year and next have been lowered, along with the GDP growth forecast for next year. The trade escalation has led to a slowdown in economic growth and inflation. In June, the Federal Reserve’s interest rate decision remained unchanged, with a robust labor market, slightly higher short-term inflation, and reduced economic uncertainty. The dot plot indicates two rate cuts within the year. The Eurozone’s June manufacturing PMI slightly missed expectations, with not much difference. Attention should be paid to U.S. non-farm payroll data.
Technical Analysis:
The euro has recently performed strongly, with a significant rise on the daily chart and new highs in the small cycle. The current position is showing oscillation, and there may be selling pressure above. If there are long positions, it is advisable to take profits at highs. In the short term, the oscillation may remain strong, waiting for a pullback to look for low long opportunities. Overall, the daily chart shows an upward oscillation, with a strong structure on a larger scale. The pressure area above is around 1.1800-1.1850, while the support area below is around 1.1580-1.1600.
Viewpoint: Oscillation is strong, focus on low long opportunities during pullbacks, and take profits at highs.
*Pre-market views are time-sensitive and limited, are predictions only, and are for reference and learning purposes only. They do not constitute investment advice, and operational risks are borne by the individual. Investment carries risks; trading requires caution.
Latest Reviews
HTFX Daily Forex Commentary 0819
HTFX Daily Forex Commentary 0815
HTFX Daily Forex Commentary 0812
HTFX Daily Forex Commentary 0811
Choose a Trusted Broker for Trading
Over 300 employees worldwide, more than 1,000 products, top-tier liquidity