|
Time
|
Data and Events
|
Importance
|
|
14:00
|
UK May Halifax Seasonally Adjusted House Price Index MoM
|
★★★
|
|
Germany April Seasonally Adjusted Industrial Production MoM
|
★★★
|
|
Germany April Seasonally Adjusted Trade Balance
|
★★★
|
|
14:45
|
France April Industrial Production MoM
|
★★★
|
|
France April Trade Balance
|
★★★
|
|
17:00
|
Eurozone Q1 GDP YoY Revision
|
★★★
|
|
Eurozone Q1 Seasonally Adjusted Employment Change QoQ Final
|
★★★
|
|
Eurozone April Retail Sales MoM
|
★★★
|
|
20:30
|
Canada May Employment Change
|
★★★
|
|
US May Unemployment Rate
|
★★★★★
|
|
US May Seasonally Adjusted Non-Farm Payrolls
|
★★★★★
|
|
US May Average Hourly Earnings YoY
|
★★★
|
|
US May Average Hourly Earnings MoM
|
★★★
|
|
Variety
|
Viewpoint
|
Support Range
|
Resistance Range
|
|
US Dollar Index
|
Short-term Fluctuation
|
97-98
|
101-102
|
|
Gold
|
Fluctuation Bias Strong
|
3280-3300
|
3400-3430
|
|
Crude Oil
|
Short-term Fluctuation
|
57-58
|
64-65
|
|
Euro
|
Fluctuation Bias Strong
|
1.1320-1.1350
|
1.1550-1.1580
|
*Pre-market views are time-sensitive and limited, are predictions only, for reference and learning purposes, do not constitute investment advice, and operational risks are borne by the individual. Investment carries risks; trading requires caution.
Fundamental Analysis:
At the beginning of May, the Federal Reserve maintained interest rates, the labor market remained resilient, and the unemployment rate was stable; the balance sheet reduction plan continues, short-term inflation has risen slightly, long-term inflation is in line with expectations, and the economy is in a stable state with increasing downside risks; the impact of tariffs may exceed expectations, creating uncertainty. In April, non-farm payrolls added 177,000 jobs, slightly exceeding expectations, and the unemployment rate remained unchanged, indicating a robust labor market. The unadjusted CPI YoY for April decreased slightly, raising expectations for future rate cuts. Attention is on Friday’s non-farm data.
Technical Analysis:
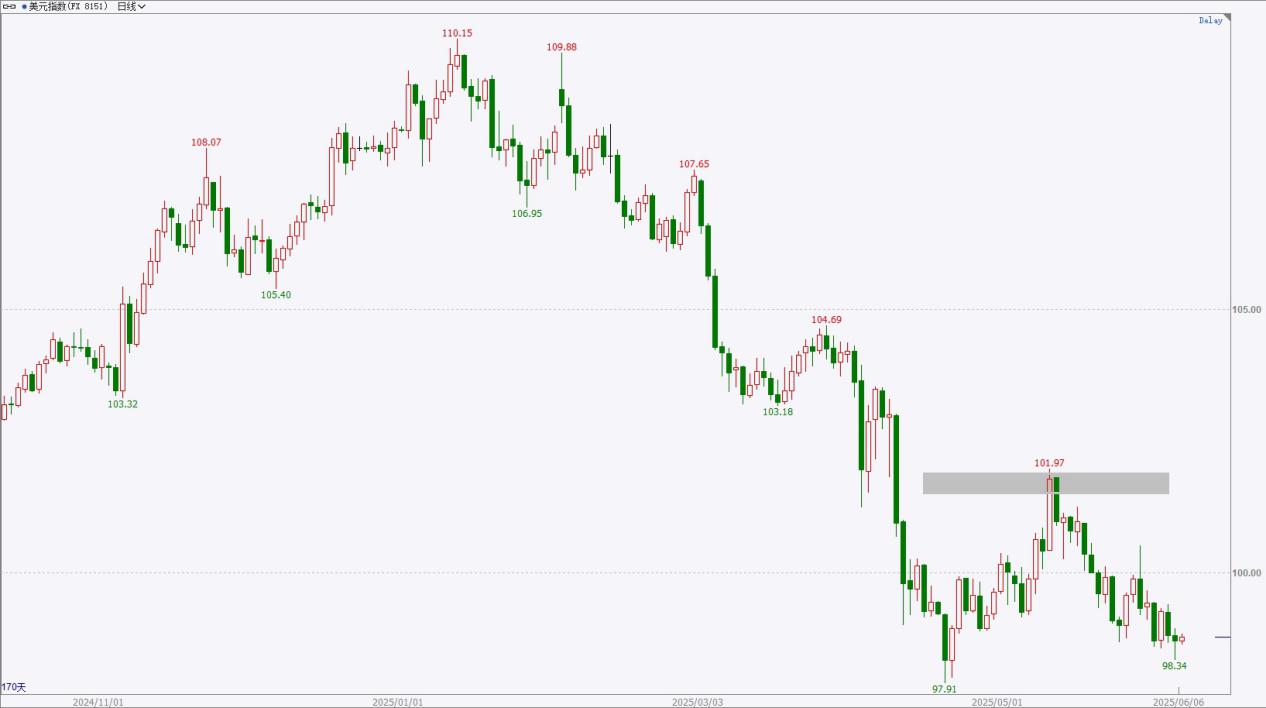
The US Dollar Index has recently fluctuated slightly, with intense competition between bulls and bears, and prices are near previous lows without signs of stabilization. In the short term, it may maintain a fluctuating structure, focusing on changes in small cycle candlesticks. Overall, the daily trend is weak, with prices at relatively low levels, and attention should be paid to whether prices will create new lows. The upper resistance area is around 101-102, while the lower support area is around 97-98.
Viewpoint: Short-term fluctuations, prices are at relatively low levels, and no stabilization signals have appeared.
*Pre-market views are time-sensitive and limited, are predictions only, for reference and learning purposes, do not constitute investment advice, and operational risks are borne by the individual. Investment carries risks; trading requires caution.
Fundamental Analysis:
Geopolitical conflicts in the Middle East are escalating, and the situation in Eastern Europe is unstable. The European Central Bank’s June interest rate decision marks the seventh consecutive 25 basis point rate cut, nearing the end of the rate-cutting cycle, with downward revisions to inflation expectations for this year and next, as well as GDP growth expectations for next year. In May, the Federal Reserve’s interest rate decision remained unchanged, the labor market is resilient, short-term inflation has risen, and the balance sheet reduction plan continues, with increasing economic downside risks. The US April non-farm data showed job additions exceeding expectations, and the unemployment rate remained unchanged; the unadjusted CPI YoY for April showed a moderate decline. Attention is on Friday’s US non-farm data.
Technical Analysis:
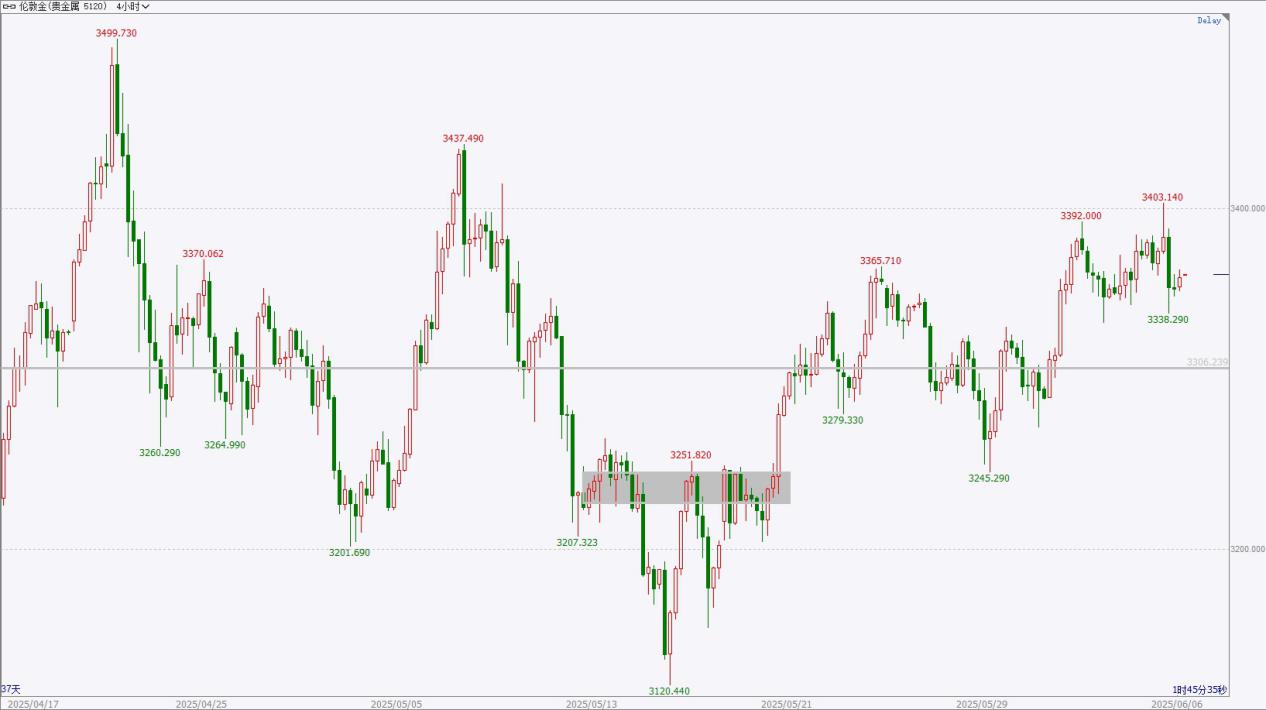
The gold price slightly rose and then fell back in the night session, with selling pressure above, and no signs of weakening yet. In the short term, the bulls still hold the advantage and may continue to push up to test resistance levels. There may be opportunities to go long on dips and take profits on highs, while paying attention to whether the price can significantly break through previous high levels. From a larger cycle perspective, the daily chart shows a high-level oscillation structure, with no signs of weakening, and it may test resistance levels. The upper resistance level is around 3400-3430, while the lower support level is around 3280-3300.
Viewpoint: Oscillating with a slight upward bias, consider going long on dips and taking profits on highs.
*Pre-market views are time-sensitive and limited, are predictions only, for reference and learning purposes, do not constitute investment advice, and operational risks are borne by the individual. Investment carries risks; trading requires caution.
Fundamental Analysis:
The May EIA monthly report basically maintains the global crude oil demand forecast for this and next year, slightly lowering the U.S. crude oil production forecast for this and next year; the OPEC monthly report maintains the global oil demand growth forecast for this year and next year, while lowering the economic growth forecast for this year; the IEA monthly report slightly raises the oil demand growth forecast for 2025. At the end of May, the OPEC+ ministerial meeting agreed to set the 2025 oil production as the benchmark for 2027 and will hold another round of negotiations in early June, potentially reaching an agreement to accelerate oil production increases in July. EIA crude oil inventories have significantly decreased, indicating a tight supply-demand structure.
Technical Analysis:
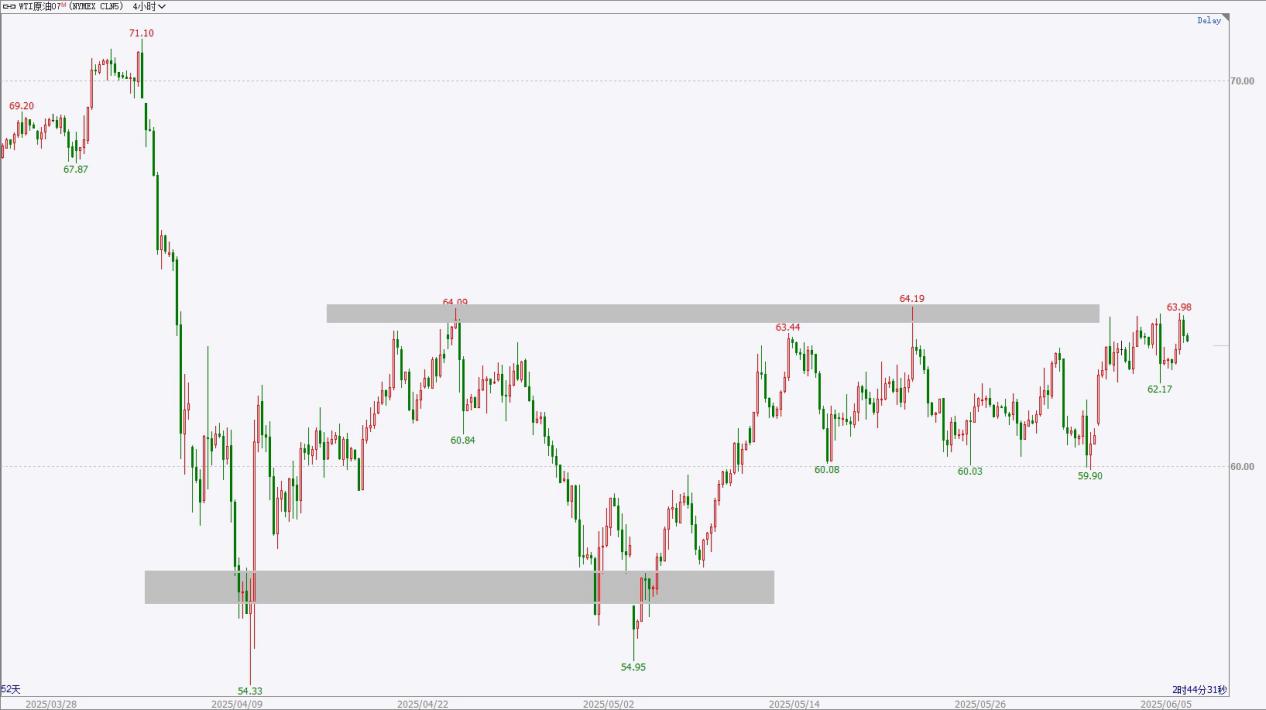
U.S. crude oil has recently shown continuous oscillation on the daily chart, with intense short-term fluctuations, and prices have tested resistance levels multiple times without a clear breakthrough. In the short term, the bulls have a slight advantage, and attention should be paid to whether the resistance level can be broken; if so, the market may strengthen. Overall, crude oil has shown weak performance previously, with repeated oscillations at low levels, and no signs of a major stabilization yet. The upper resistance area is around 64-65, while the lower support area is around 57-58.
Viewpoint: Short-term oscillation, with bulls slightly in favor, pay attention to whether the resistance structure can be broken.
*Pre-market views are time-sensitive and limited, are predictions only, for reference and learning purposes, do not constitute investment advice, and operational risks are borne by the individual. Investment carries risks; trading requires caution.
Fundamental Analysis:
The European Central Bank’s June interest rate decision saw a continuous seventh rate cut of 25 basis points, nearing the end of the rate-cutting cycle, with no discussion on neutral interest rates. The inflation forecast for this and next year has been lowered, and the GDP growth forecast for next year has also been lowered, with trade upgrades leading to slower economic growth and inflation. The May Federal Reserve interest rate decision remained unchanged, with a resilient labor market, a short-term rise in inflation, and a continued balance sheet reduction plan, while economic downside risks have increased. The Eurozone’s May manufacturing PMI showed slight fluctuations, with a neutral short-term impact. Attention is on the U.S. non-farm payroll data on Friday.
Technical Analysis:
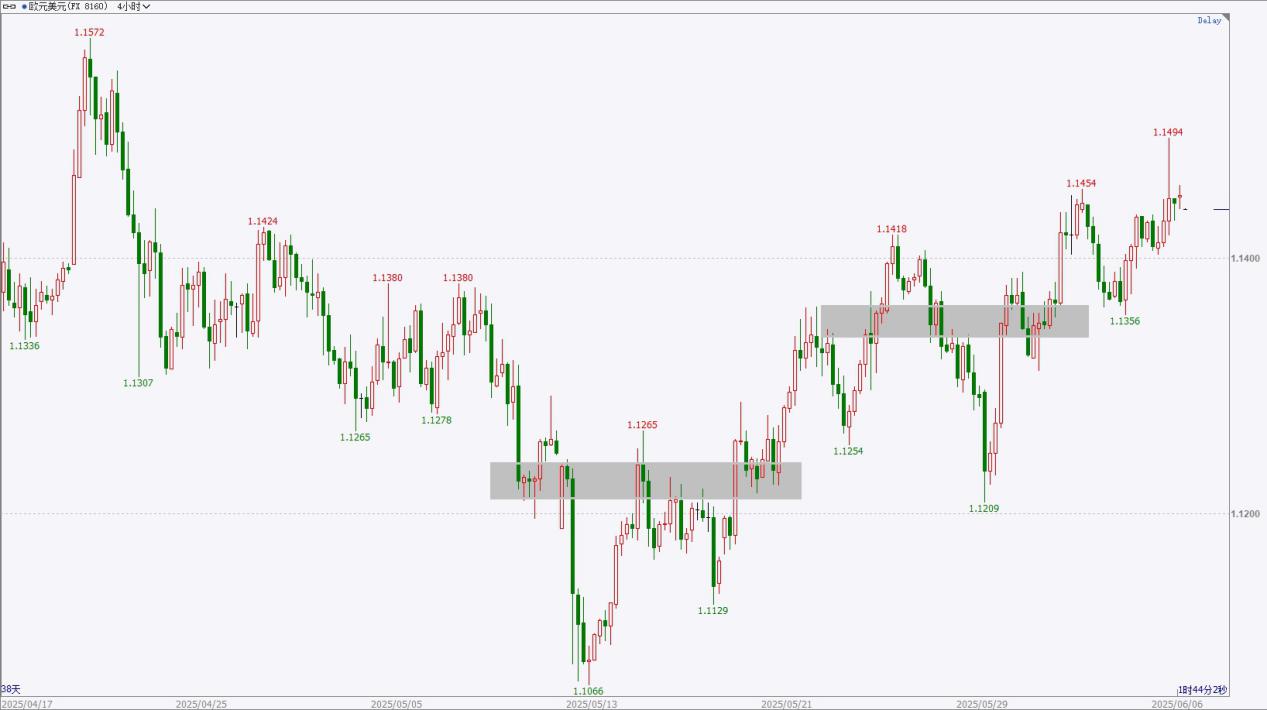
The euro price rose slightly yesterday, with a short-term high followed by a pullback, showing a strong performance without signs of weakening. It may continue to test the upper resistance level, primarily focusing on going long on dips and taking profits on highs. Overall, the daily chart shows an upward oscillation, potentially testing previous high resistance levels. The upper resistance area is around 1.1550-1.1580, while the lower support area is around 1.1320-1.1350.
Viewpoint: Oscillating with a slight upward bias, consider trying long opportunities on dips and taking profits on highs.
*Pre-market views are time-sensitive and limited, are predictions only, for reference and learning purposes, do not constitute investment advice, and operational risks are borne by the individual. Investment carries risks; trading requires caution.
Daily Reviews
Our award-winning team of analysts provides keen and insightful technical and fundamental analysis to understand daily market news and investment trading opportunities
HTFX Daily Forex Commentary 0606
Time
Data and Events
Importance
14:00
UK May Halifax Seasonally Adjusted House Price Index MoM
★★★
Germany April Seasonally Adjusted Industrial Production MoM
★★★
Germany April Seasonally Adjusted Trade Balance
★★★
14:45
France April Industrial Production MoM
★★★
France April Trade Balance
★★★
17:00
Eurozone Q1 GDP YoY Revision
★★★
Eurozone Q1 Seasonally Adjusted Employment Change QoQ Final
★★★
Eurozone April Retail Sales MoM
★★★
20:30
Canada May Employment Change
★★★
US May Unemployment Rate
★★★★★
US May Seasonally Adjusted Non-Farm Payrolls
★★★★★
US May Average Hourly Earnings YoY
★★★
US May Average Hourly Earnings MoM
★★★
Variety
Viewpoint
Support Range
Resistance Range
US Dollar Index
Short-term Fluctuation
97-98
101-102
Gold
Fluctuation Bias Strong
3280-3300
3400-3430
Crude Oil
Short-term Fluctuation
57-58
64-65
Euro
Fluctuation Bias Strong
1.1320-1.1350
1.1550-1.1580
*Pre-market views are time-sensitive and limited, are predictions only, for reference and learning purposes, do not constitute investment advice, and operational risks are borne by the individual. Investment carries risks; trading requires caution.
Fundamental Analysis:
At the beginning of May, the Federal Reserve maintained interest rates, the labor market remained resilient, and the unemployment rate was stable; the balance sheet reduction plan continues, short-term inflation has risen slightly, long-term inflation is in line with expectations, and the economy is in a stable state with increasing downside risks; the impact of tariffs may exceed expectations, creating uncertainty. In April, non-farm payrolls added 177,000 jobs, slightly exceeding expectations, and the unemployment rate remained unchanged, indicating a robust labor market. The unadjusted CPI YoY for April decreased slightly, raising expectations for future rate cuts. Attention is on Friday’s non-farm data.
Technical Analysis:
The US Dollar Index has recently fluctuated slightly, with intense competition between bulls and bears, and prices are near previous lows without signs of stabilization. In the short term, it may maintain a fluctuating structure, focusing on changes in small cycle candlesticks. Overall, the daily trend is weak, with prices at relatively low levels, and attention should be paid to whether prices will create new lows. The upper resistance area is around 101-102, while the lower support area is around 97-98.
Viewpoint: Short-term fluctuations, prices are at relatively low levels, and no stabilization signals have appeared.
*Pre-market views are time-sensitive and limited, are predictions only, for reference and learning purposes, do not constitute investment advice, and operational risks are borne by the individual. Investment carries risks; trading requires caution.
Fundamental Analysis:
Geopolitical conflicts in the Middle East are escalating, and the situation in Eastern Europe is unstable. The European Central Bank’s June interest rate decision marks the seventh consecutive 25 basis point rate cut, nearing the end of the rate-cutting cycle, with downward revisions to inflation expectations for this year and next, as well as GDP growth expectations for next year. In May, the Federal Reserve’s interest rate decision remained unchanged, the labor market is resilient, short-term inflation has risen, and the balance sheet reduction plan continues, with increasing economic downside risks. The US April non-farm data showed job additions exceeding expectations, and the unemployment rate remained unchanged; the unadjusted CPI YoY for April showed a moderate decline. Attention is on Friday’s US non-farm data.
Technical Analysis:
The gold price slightly rose and then fell back in the night session, with selling pressure above, and no signs of weakening yet. In the short term, the bulls still hold the advantage and may continue to push up to test resistance levels. There may be opportunities to go long on dips and take profits on highs, while paying attention to whether the price can significantly break through previous high levels. From a larger cycle perspective, the daily chart shows a high-level oscillation structure, with no signs of weakening, and it may test resistance levels. The upper resistance level is around 3400-3430, while the lower support level is around 3280-3300.
Viewpoint: Oscillating with a slight upward bias, consider going long on dips and taking profits on highs.
*Pre-market views are time-sensitive and limited, are predictions only, for reference and learning purposes, do not constitute investment advice, and operational risks are borne by the individual. Investment carries risks; trading requires caution.
Fundamental Analysis:
The May EIA monthly report basically maintains the global crude oil demand forecast for this and next year, slightly lowering the U.S. crude oil production forecast for this and next year; the OPEC monthly report maintains the global oil demand growth forecast for this year and next year, while lowering the economic growth forecast for this year; the IEA monthly report slightly raises the oil demand growth forecast for 2025. At the end of May, the OPEC+ ministerial meeting agreed to set the 2025 oil production as the benchmark for 2027 and will hold another round of negotiations in early June, potentially reaching an agreement to accelerate oil production increases in July. EIA crude oil inventories have significantly decreased, indicating a tight supply-demand structure.
Technical Analysis:
U.S. crude oil has recently shown continuous oscillation on the daily chart, with intense short-term fluctuations, and prices have tested resistance levels multiple times without a clear breakthrough. In the short term, the bulls have a slight advantage, and attention should be paid to whether the resistance level can be broken; if so, the market may strengthen. Overall, crude oil has shown weak performance previously, with repeated oscillations at low levels, and no signs of a major stabilization yet. The upper resistance area is around 64-65, while the lower support area is around 57-58.
Viewpoint: Short-term oscillation, with bulls slightly in favor, pay attention to whether the resistance structure can be broken.
*Pre-market views are time-sensitive and limited, are predictions only, for reference and learning purposes, do not constitute investment advice, and operational risks are borne by the individual. Investment carries risks; trading requires caution.
Fundamental Analysis:
The European Central Bank’s June interest rate decision saw a continuous seventh rate cut of 25 basis points, nearing the end of the rate-cutting cycle, with no discussion on neutral interest rates. The inflation forecast for this and next year has been lowered, and the GDP growth forecast for next year has also been lowered, with trade upgrades leading to slower economic growth and inflation. The May Federal Reserve interest rate decision remained unchanged, with a resilient labor market, a short-term rise in inflation, and a continued balance sheet reduction plan, while economic downside risks have increased. The Eurozone’s May manufacturing PMI showed slight fluctuations, with a neutral short-term impact. Attention is on the U.S. non-farm payroll data on Friday.
Technical Analysis:
The euro price rose slightly yesterday, with a short-term high followed by a pullback, showing a strong performance without signs of weakening. It may continue to test the upper resistance level, primarily focusing on going long on dips and taking profits on highs. Overall, the daily chart shows an upward oscillation, potentially testing previous high resistance levels. The upper resistance area is around 1.1550-1.1580, while the lower support area is around 1.1320-1.1350.
Viewpoint: Oscillating with a slight upward bias, consider trying long opportunities on dips and taking profits on highs.
*Pre-market views are time-sensitive and limited, are predictions only, for reference and learning purposes, do not constitute investment advice, and operational risks are borne by the individual. Investment carries risks; trading requires caution.
Latest Reviews
HTFX Daily Forex Commentary 0819
HTFX Daily Forex Commentary 0815
HTFX Daily Forex Commentary 0812
HTFX Daily Forex Commentary 0811
Choose a Trusted Broker for Trading
Over 300 employees worldwide, more than 1,000 products, top-tier liquidity